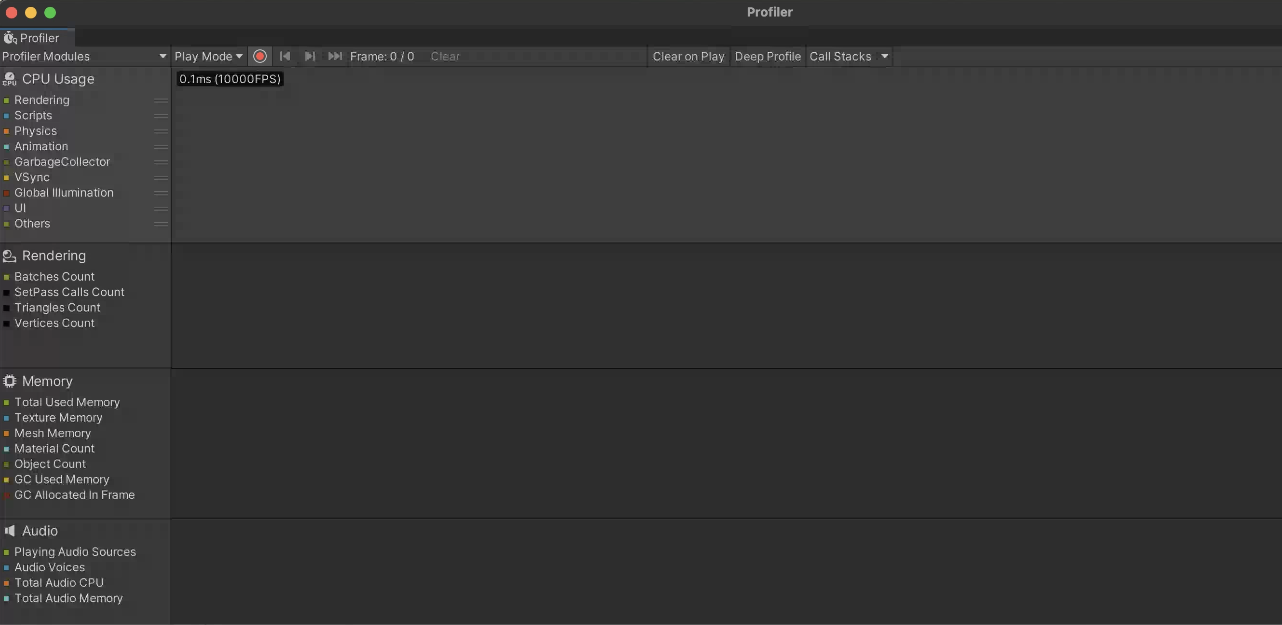
Profiler는 CPU, 메모리, 렌더러, 오디오와 같은 영역에서 응용 프로그램의 성능에 대한 데이터를 수집하고 표시한다.
* Profiler 설정
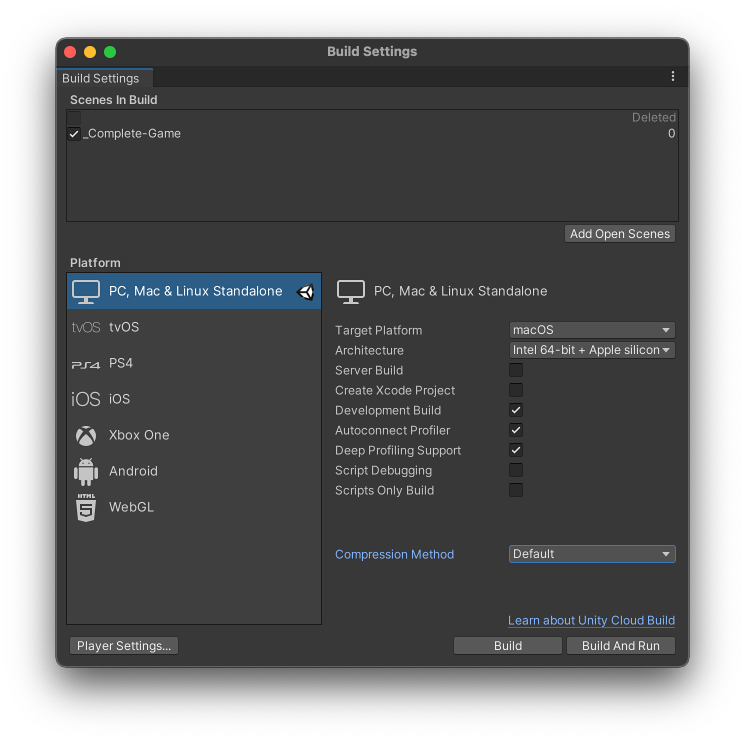
- Autoconnect Profiler: 빌드 과정에서 Unity Editor 가 IP 주소를 빌드된 Player 에 추가한다.
Player 가 시작될 때 구운 IP 주소에 있는 Editor 에서 Profiler 에 연결을 시도해서 자동으로 Profiler 를 돌릴 수 있다.
- Deep Profiling Support: Profiler Markers에 명시된 부분뿐 아니라 모드의 모든 부분을 Profiling 한다. 빌드에 약간의 오버헤드가 추가 된다.
=> Android, iOS 모바일 장치에서 원격 프로파일링도 지원한다!
* Common Profiler Markers
Unity - Manual: Common Profiler markers
Profiling your application Common Profiler markers Unity’s code is instrumented with a large number of ProfilerA window that helps you to optimize your game. It shows how much time is spent in the various areas of your game. For example, it can report th
docs.unity3d.com
* Profiler Window
Unity - Manual: The Profiler window
Asset Loading Profiler module The Profiler window To access the Unity Profiler, go to Window > Analysis > Profiler or use the keyboard shortcut Ctrl+7 (Command+7 on macOS). The ProfilerA window that helps you to optimize your game. It shows how much time i
docs.unity3d.com
'🎮 Unity Study > Unity' 카테고리의 다른 글
| [Unity Document Study] 3주차 :: Unity Package Manager (0) | 2024.05.20 |
|---|---|
| [Unity Document Study] 2주차 :: Asset Workflow (0) | 2024.05.11 |
| [Unity Document Study] 1주차 :: Unity Analysis - Memory in Unity (0) | 2024.05.01 |
| [Unity] Prefab Variant 프리팹 상속 (0) | 2024.04.30 |
| [Unity] Sound 모바일 최적화 (0) | 2024.04.30 |